
Demo buildSales dashboard with AI findings
Trendline
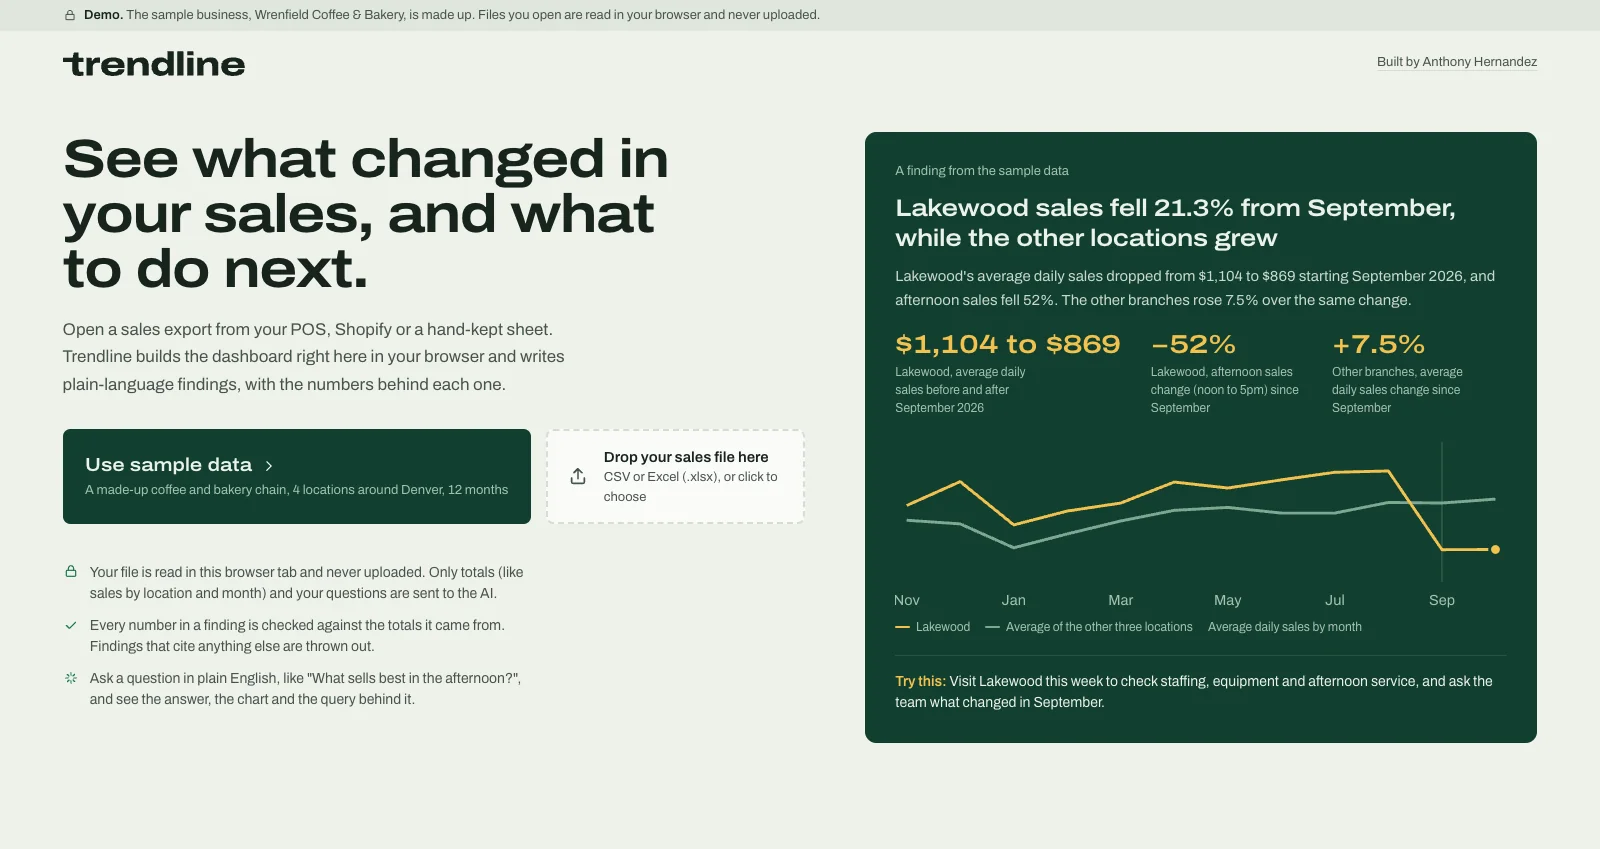
Drop in a sales export and see what changed by location and product, then ask in plain words.
AI findings on a sales file, then a question answered with its query.
Owners of multi-location businesses export their sales every month and still can't tell what changed or why.
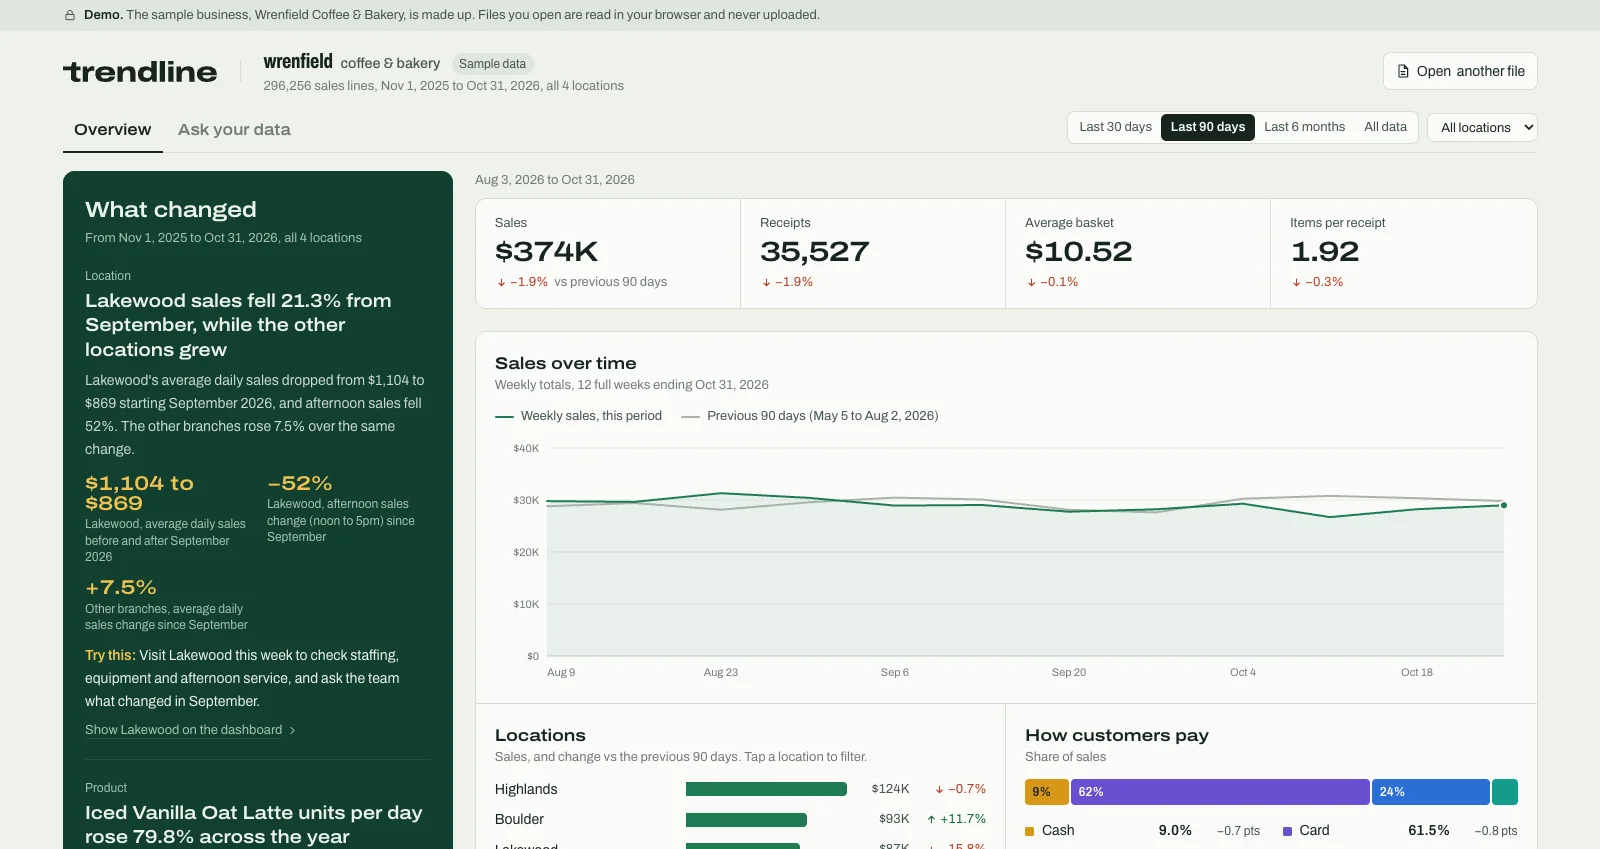
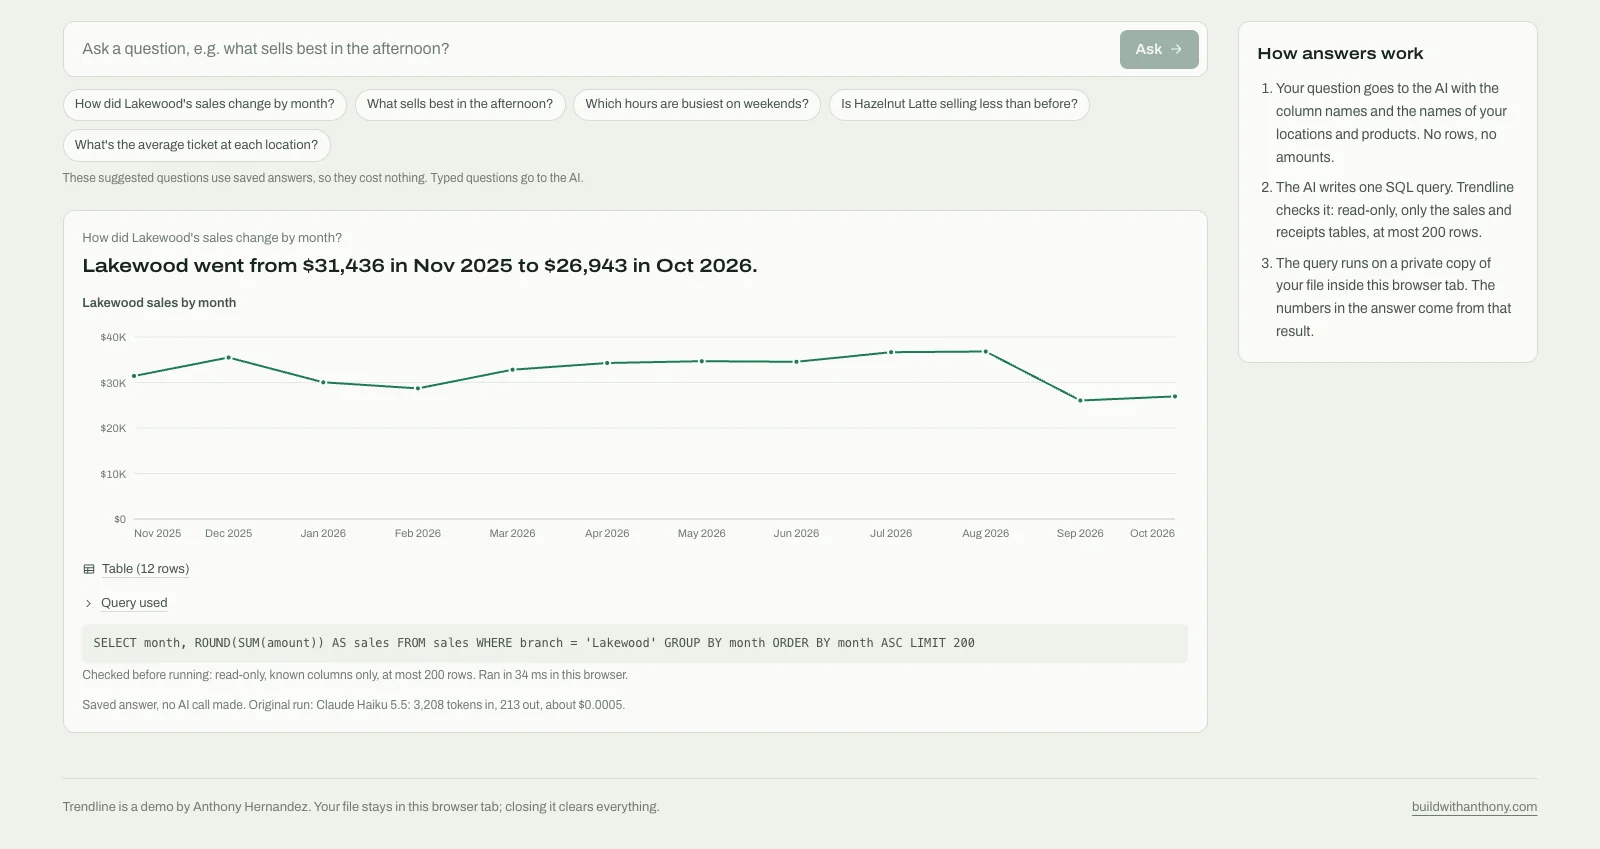
Trendline reads a POS or spreadsheet export right in the browser and builds the dashboard an owner actually needs. It writes plain-language findings, and every number is checked against the data before it shows. Ask a question and see the answer, the chart and the exact query behind it.
The file never leaves the browser: the database runs on the page, and only totals are sent to the AI.
Up close
Want something like this for your team?
A 30-minute call is enough to tell whether software can fix it, and what the smallest useful version would be.